< Back
Excel: Avoid gaps in an Excel chart
Post
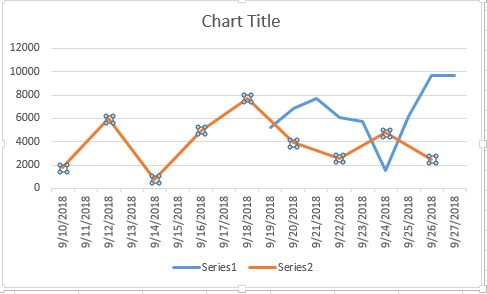
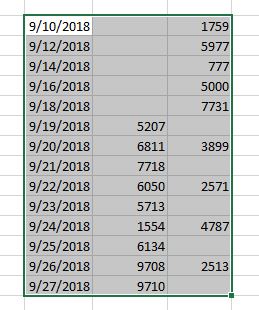
When you create a Line chart in Microsoft Excel, the chart may contain a gaps in a line. This will occur when the data range for the Line chart contains one or more blank cells.
To work around this issue you can use one of the following methods:
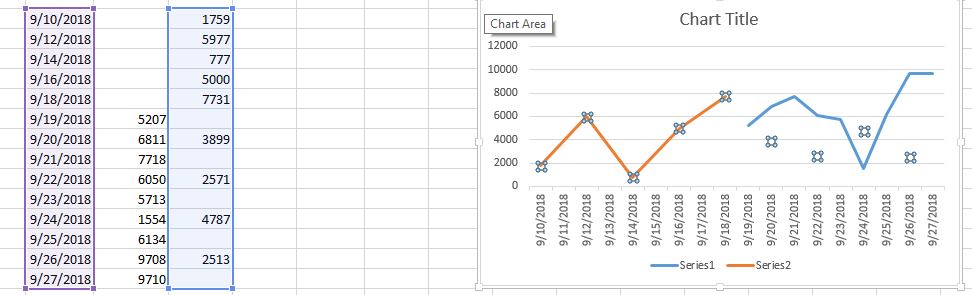
Plot empty cells as interpolated. To do this, follow these steps:
To work around this issue you can use one of the following methods:
Plot empty cells as interpolated. To do this, follow these steps:
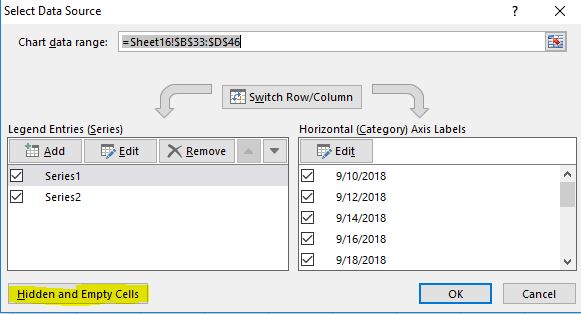
- Select the chart, and right click anywhere within the chart.
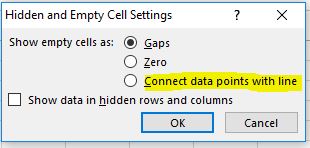
- Click Select Data and then click Hidden and Empty Cells.
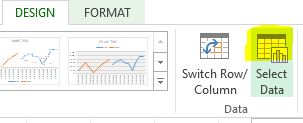
- Click to select Connect data points with line, and then Press OK twice.
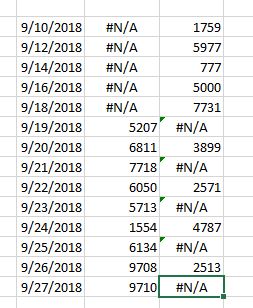
- In the blank cell, type #N/A.
- In the formula bar for the blank cell, type =NA().
Any option you use would result in a continuous line chart as below