< Back
Excel: Create Combo Charts
Post
Combination Chart
A combination chart is a chart that combines two or more chart types in a single chart.
To create a combination chart you can follow these steps.
A combination chart is a chart that combines two or more chart types in a single chart.
To create a combination chart you can follow these steps.
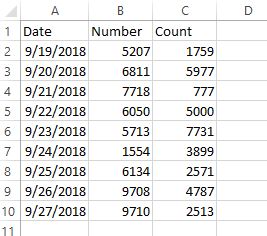
- Your data should be in columns as below.
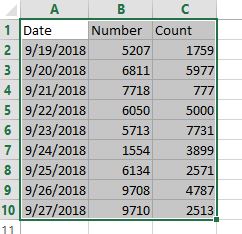
- Select the range of data that you need to include in the chart. Here it is A1:C10.
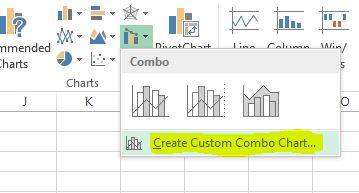
- Go to the Insert tab; in the Charts section, click the Combo symbol.

- Click on Create Custom Combo Chart...
- The Insert Chart dialog box appears. Here select the type of chart that you need for both data sets
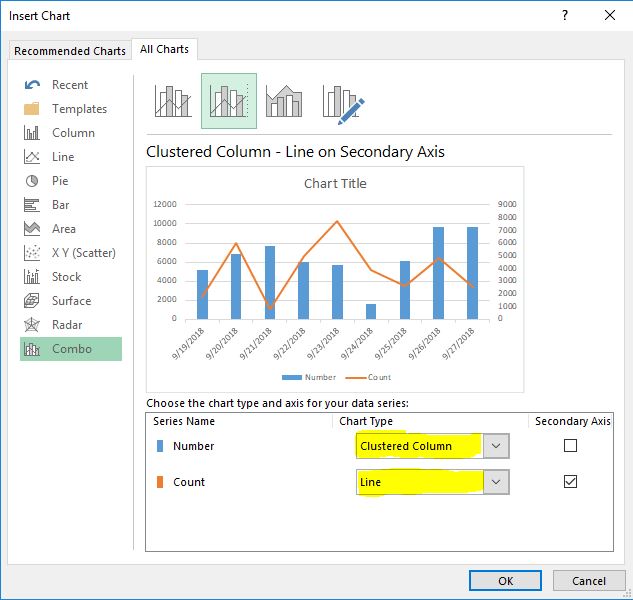
- Click on the drop down next to the data field to choose the type of chart that you like.
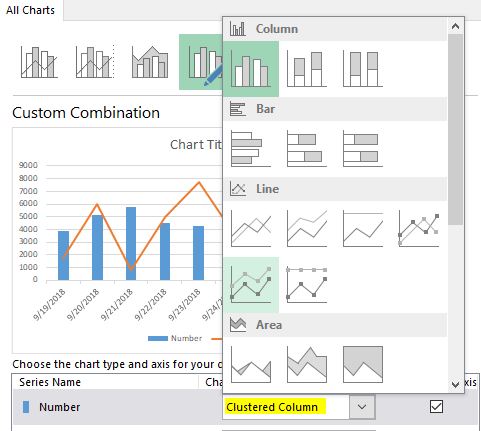
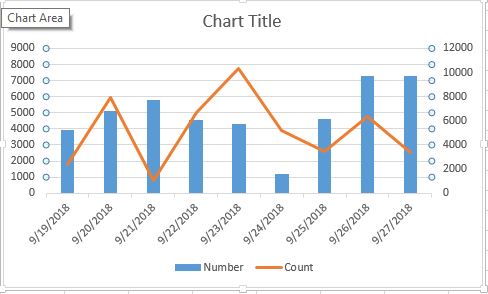
- Click OK. Here is an example of Clustered bar and Line chart.